blog
Troubleshooting application failures with Logfire
· logfire · opentelemetry · observability · debugging · pydantic-ai
TLDR
Most application failures arrive as a single sentence wrapped in a retry counter — the read operation timed out, attempt 4 of 4 — which collapses the signal into a string and erases the shape of the failure. This post is a workflow for using Logfire to recover that shape: five SQL queries against your traces, in a fixed order, that take you from “something failed” to “here is the line of code.” The queries work against any OpenTelemetry-instrumented system; the example is a real production bug in an LLM agent, diagnosed in under thirty minutes.
The trap a flat log stream sets
A flat log stream collapses four attempts into one terminal counter and throws away the relationship between events — which is exactly the part that names the bug.
A failure surfaces. You go to look. The application’s own logs say:
21:30:23  task started: handle inbound email
21:31:29  retrying (transient)
21:32:00  retrying (transient)
21:33:30  retrying (transient)
21:36:30  failed: max_attempts (The read operation timed out)
This is the wall most logging systems put you against. Four attempts, one terminal message, one counter. The retry classifier saw the exception as transient, so the daemon’s own logs say nothing more interesting than retrying. You cannot tell from this whether it was an API blip, a slow model call, a stuck subscription, or a real bug. There is no obvious next click.
A traditional log file would, if you scrolled hard enough, show you something like:
21:31:29.384  tool start: read_drive_markdown
21:31:29.385  tool start: read_drive_markdown
21:31:30.509  tool end:   read_drive_markdown
21:32:30.216  tool error: TimeoutError
Four lines among thousands, with nothing to tell you they belonged to the same logical operation, or that the two start lines were racing on shared state. The relationship between them — the part that names the bug — is exactly what flat logs throw away.
Structured tracing is how you get it back.
The setup: what makes the workflow possible
Two things need to be true before any of this works. Both are one-time setup, not per-investigation work.
One: domain identifiers are attached to spans.
If your application handles tasks, emails, accounts, or anything else with an ID,
attach that ID as a span attribute on every span that touches it.
Logfire stores attributes as JSON, queryable with the standard ->> operator.
Without this, you cannot filter the trillions of spans down to the handful
that touched the failing entity.
Two: framework instrumentation is in place. OpenTelemetry’s gen_ai.* semantic conventions standardize how LLM frameworks tag tool names, call IDs, arguments, and responses. Pydantic AI emits them automatically. The same is true for the standard HTTP, database, and queue instrumentations. The payoff is that the SQL below is portable: it works against any deployment that follows the conventions, not just yours.
A third habit, smaller but load-bearing: every query filters on deployment_environment.
Logfire populates that attribute automatically from your OTel setup.
The moment you run code on more than one machine,
filtering by environment becomes the difference between a clean trace view and an unreadable one.
Query 1 — find any span tied to the failure
Query 1 filters on your domain ID to surface a trace ID — you are not understanding the failure yet, just making it addressable.
You have an ID for the thing that failed. A task ID, a request ID, an email ID — whatever your domain uses. The first query is always the same shape:
SELECT start_timestamp, span_name, level, message,
       exception_type, exception_message, trace_id, span_id
FROM records
WHERE deployment_environment = 'production'
  AND attributes->>'task_id' = '019e6b46-66ea-75c2-846b-f02acf19b321'
ORDER BY start_timestamp DESC
LIMIT 100
You are not trying to understand anything yet.
You are trying to surface a trace_id.
Once you have that,
the entire causal context of the failure becomes addressable in a single follow-up query.
In the example bug, this query returned a run.task.agent_failed span
carrying exception_type = 'TimeoutError' and the trace ID 019e6b596ee79a3a7bd5d48d62d2856c.
Logfire confirmed what the application logs already said — a timeout —
but it also gave me the one thing the application logs could not.
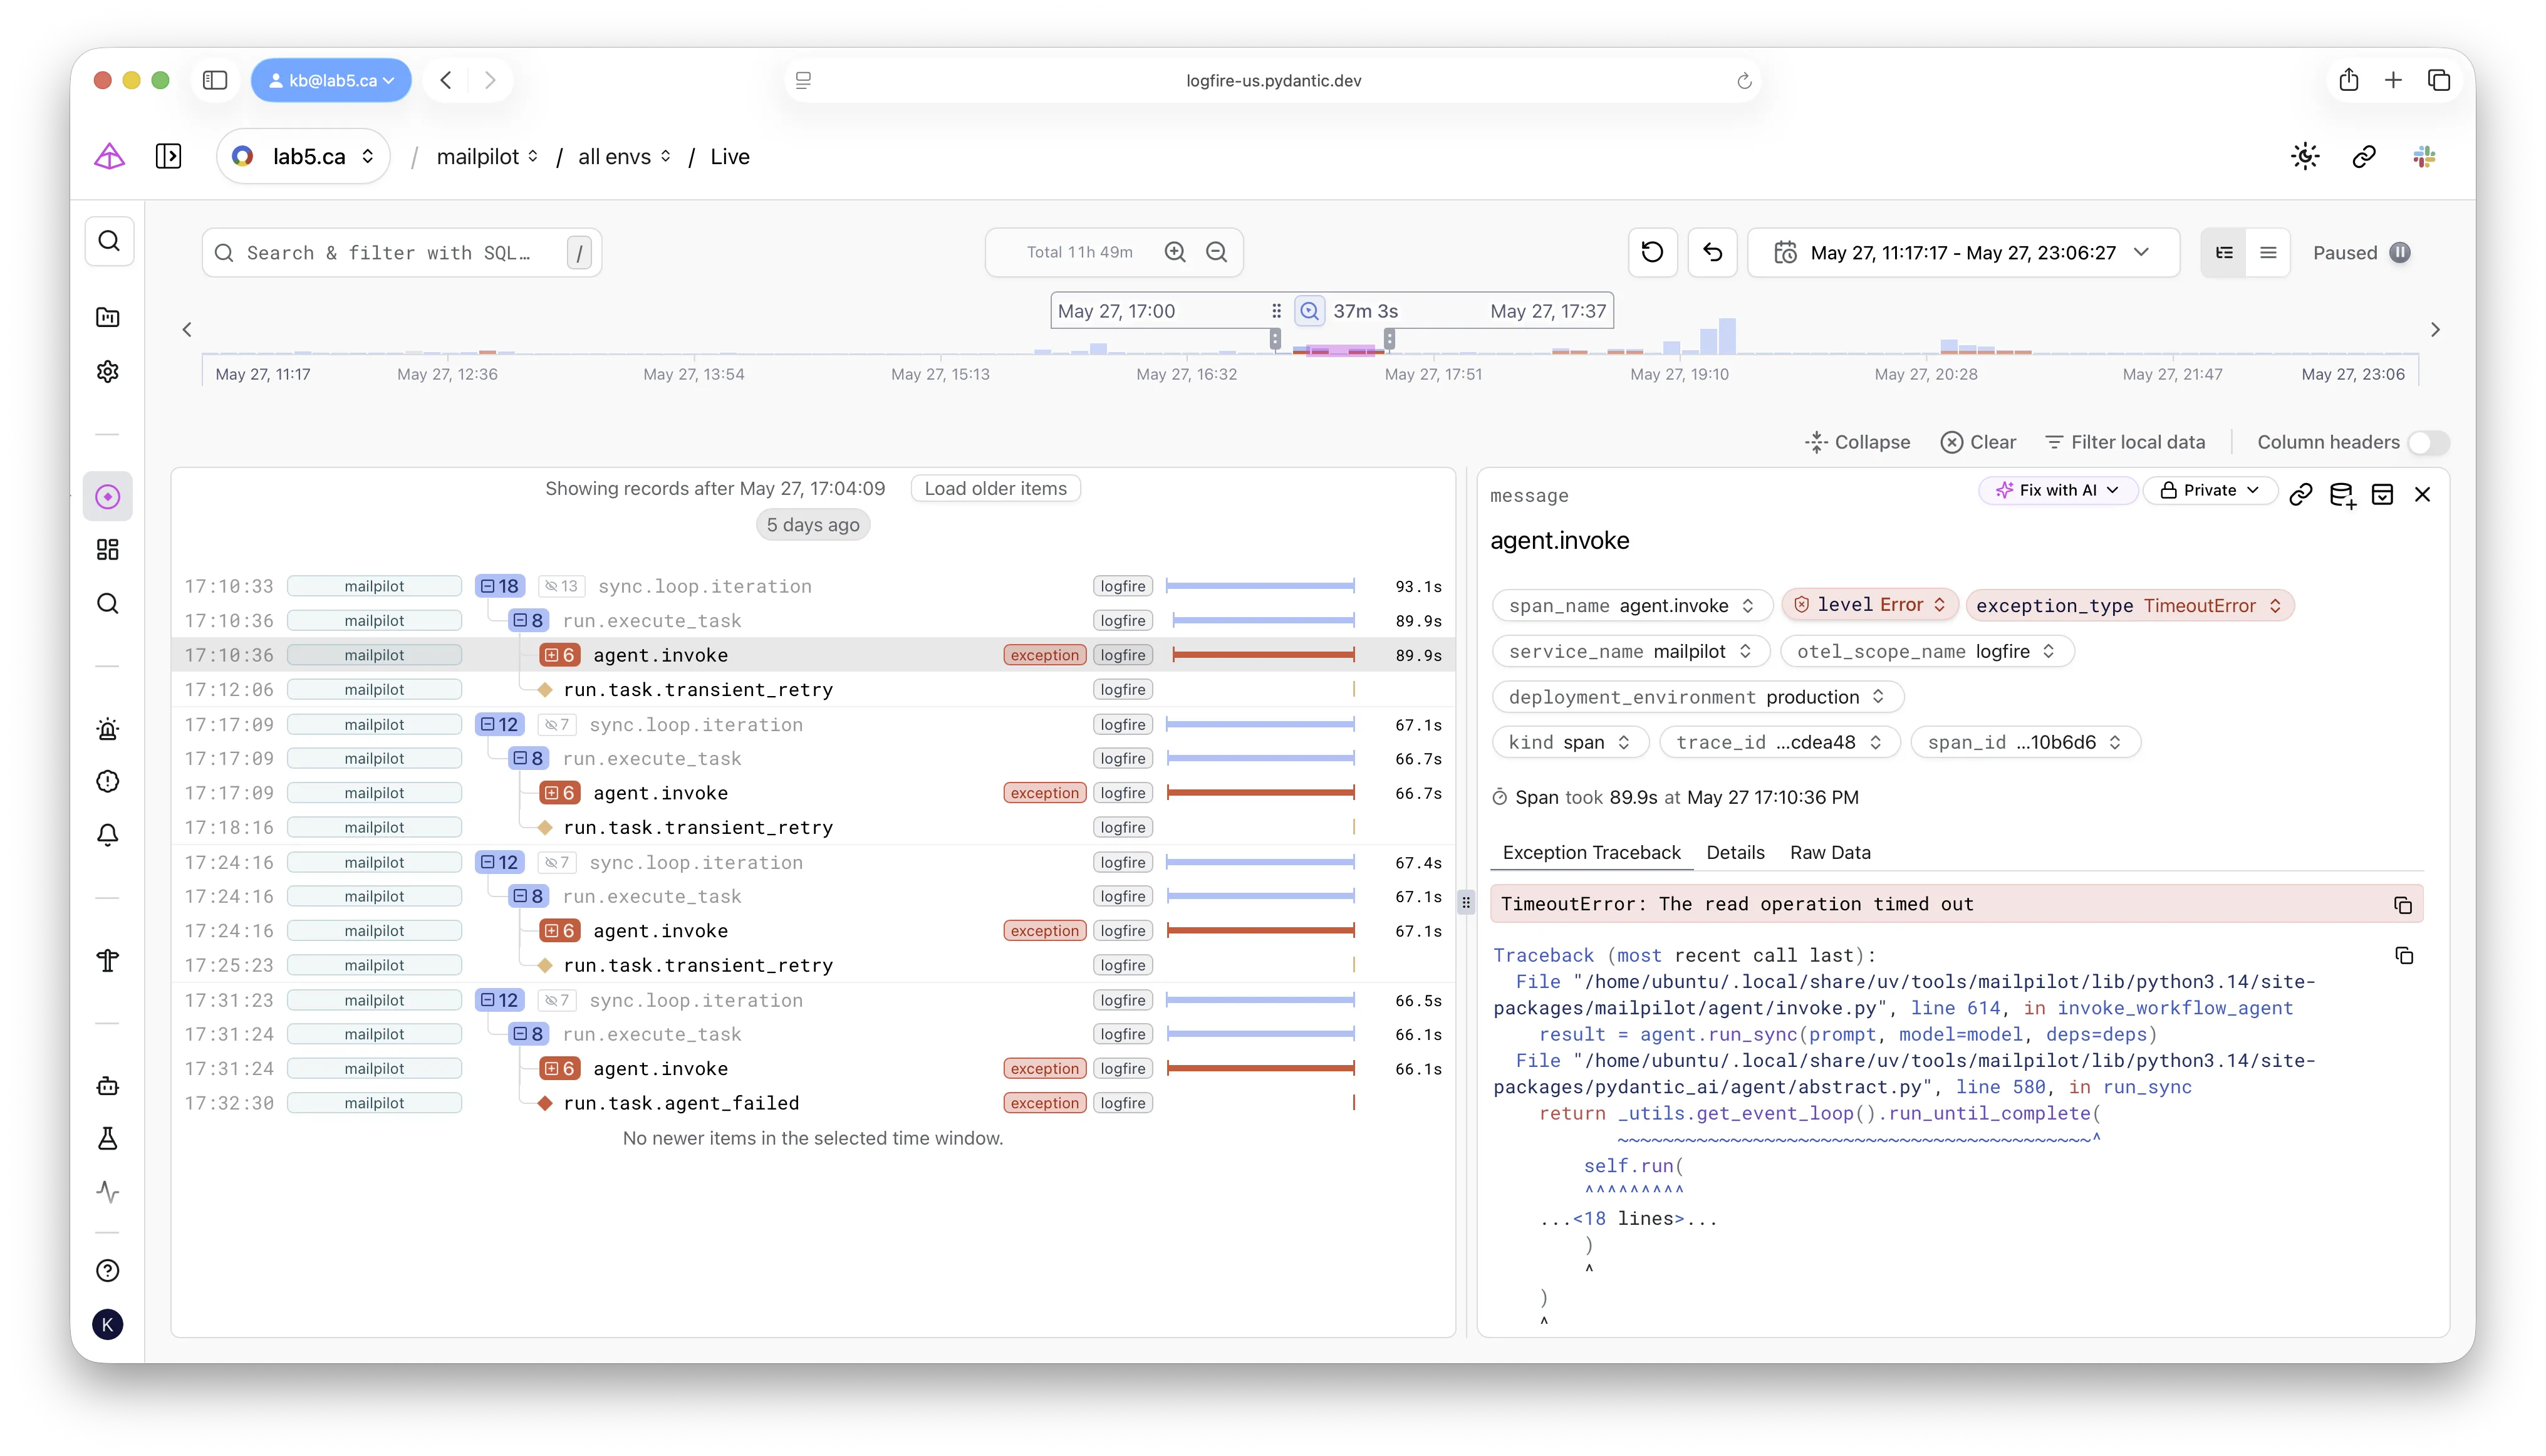 Naming the failure: selecting the failed span surfaces the exception type, message,
and the full Python traceback — columns, not substrings of a log line.
Naming the failure: selecting the failed span surfaces the exception type, message,
and the full Python traceback — columns, not substrings of a log line.
Query 2 — pull the full trace tree
Two sibling tool calls dispatched 403 microseconds apart — one returning in a second, one hanging for the full socket timeout — name a concurrency bug that a flat log stream physically cannot show.
This is the query that pivots most investigations from blind to obvious.
SELECT start_timestamp, span_name, duration, level, message,
       exception_type, exception_message, span_id, parent_span_id
FROM records
WHERE deployment_environment = 'production'
  AND trace_id = '019e6b596ee79a3a7bd5d48d62d2856c'
ORDER BY start_timestamp ASC
LIMIT 200
Reconstruct the parent-child structure via parent_span_id and render it as a tree.
For the example bug, the result was:
sync.loop.iteration                                            66.49s
├── sync.account.run                                            0.37s
│   ├── gmail.get_history                                       0.07s
│   └── gmail.get_messages_batch                                0.00s
└── run.execute_task                                           66.11s
    ├── agent.invoke                                           66.10s   TimeoutError
    │   └── agent run (mailpilot.workflow)                     66.06s   TimeoutError
    │       ├── chat claude-sonnet-4-6                          2.44s
    │       ├── running tool: search_drive_markdown             0.38s
    │       ├── chat claude-sonnet-4-6                          2.39s
    │       ├── running tool: read_drive_markdown               1.12s
    │       └── running tool: read_drive_markdown              60.83s   TimeoutError
    └── run.task.agent_failed                                  ----     TimeoutError
Look at the last two leaves.
Two sibling tool spans, both named read_drive_markdown, dispatched under the same LLM turn.
One returned in 1.12 seconds.
The other took 60.83 seconds to raise TimeoutError.
Their raw start timestamps were:
2026-05-27T21:31:29.384849Z2026-05-27T21:31:29.385252Z
The two calls began 403 microseconds apart. That is the smoking gun. The model was not slow. The file was not corrupt. Two tool calls were dispatched in parallel, one hung for the exact duration of the configured 60-second socket timeout, and the unhandled timeout killed the whole agent run.
The reason this works is the parent-child structure. A flat log stream cannot distinguish two calls racing on shared state from two calls that happened near each other. The span tree preserves the relationship between them — both as siblings of a single LLM turn — and that relationship is what carries the diagnosis.
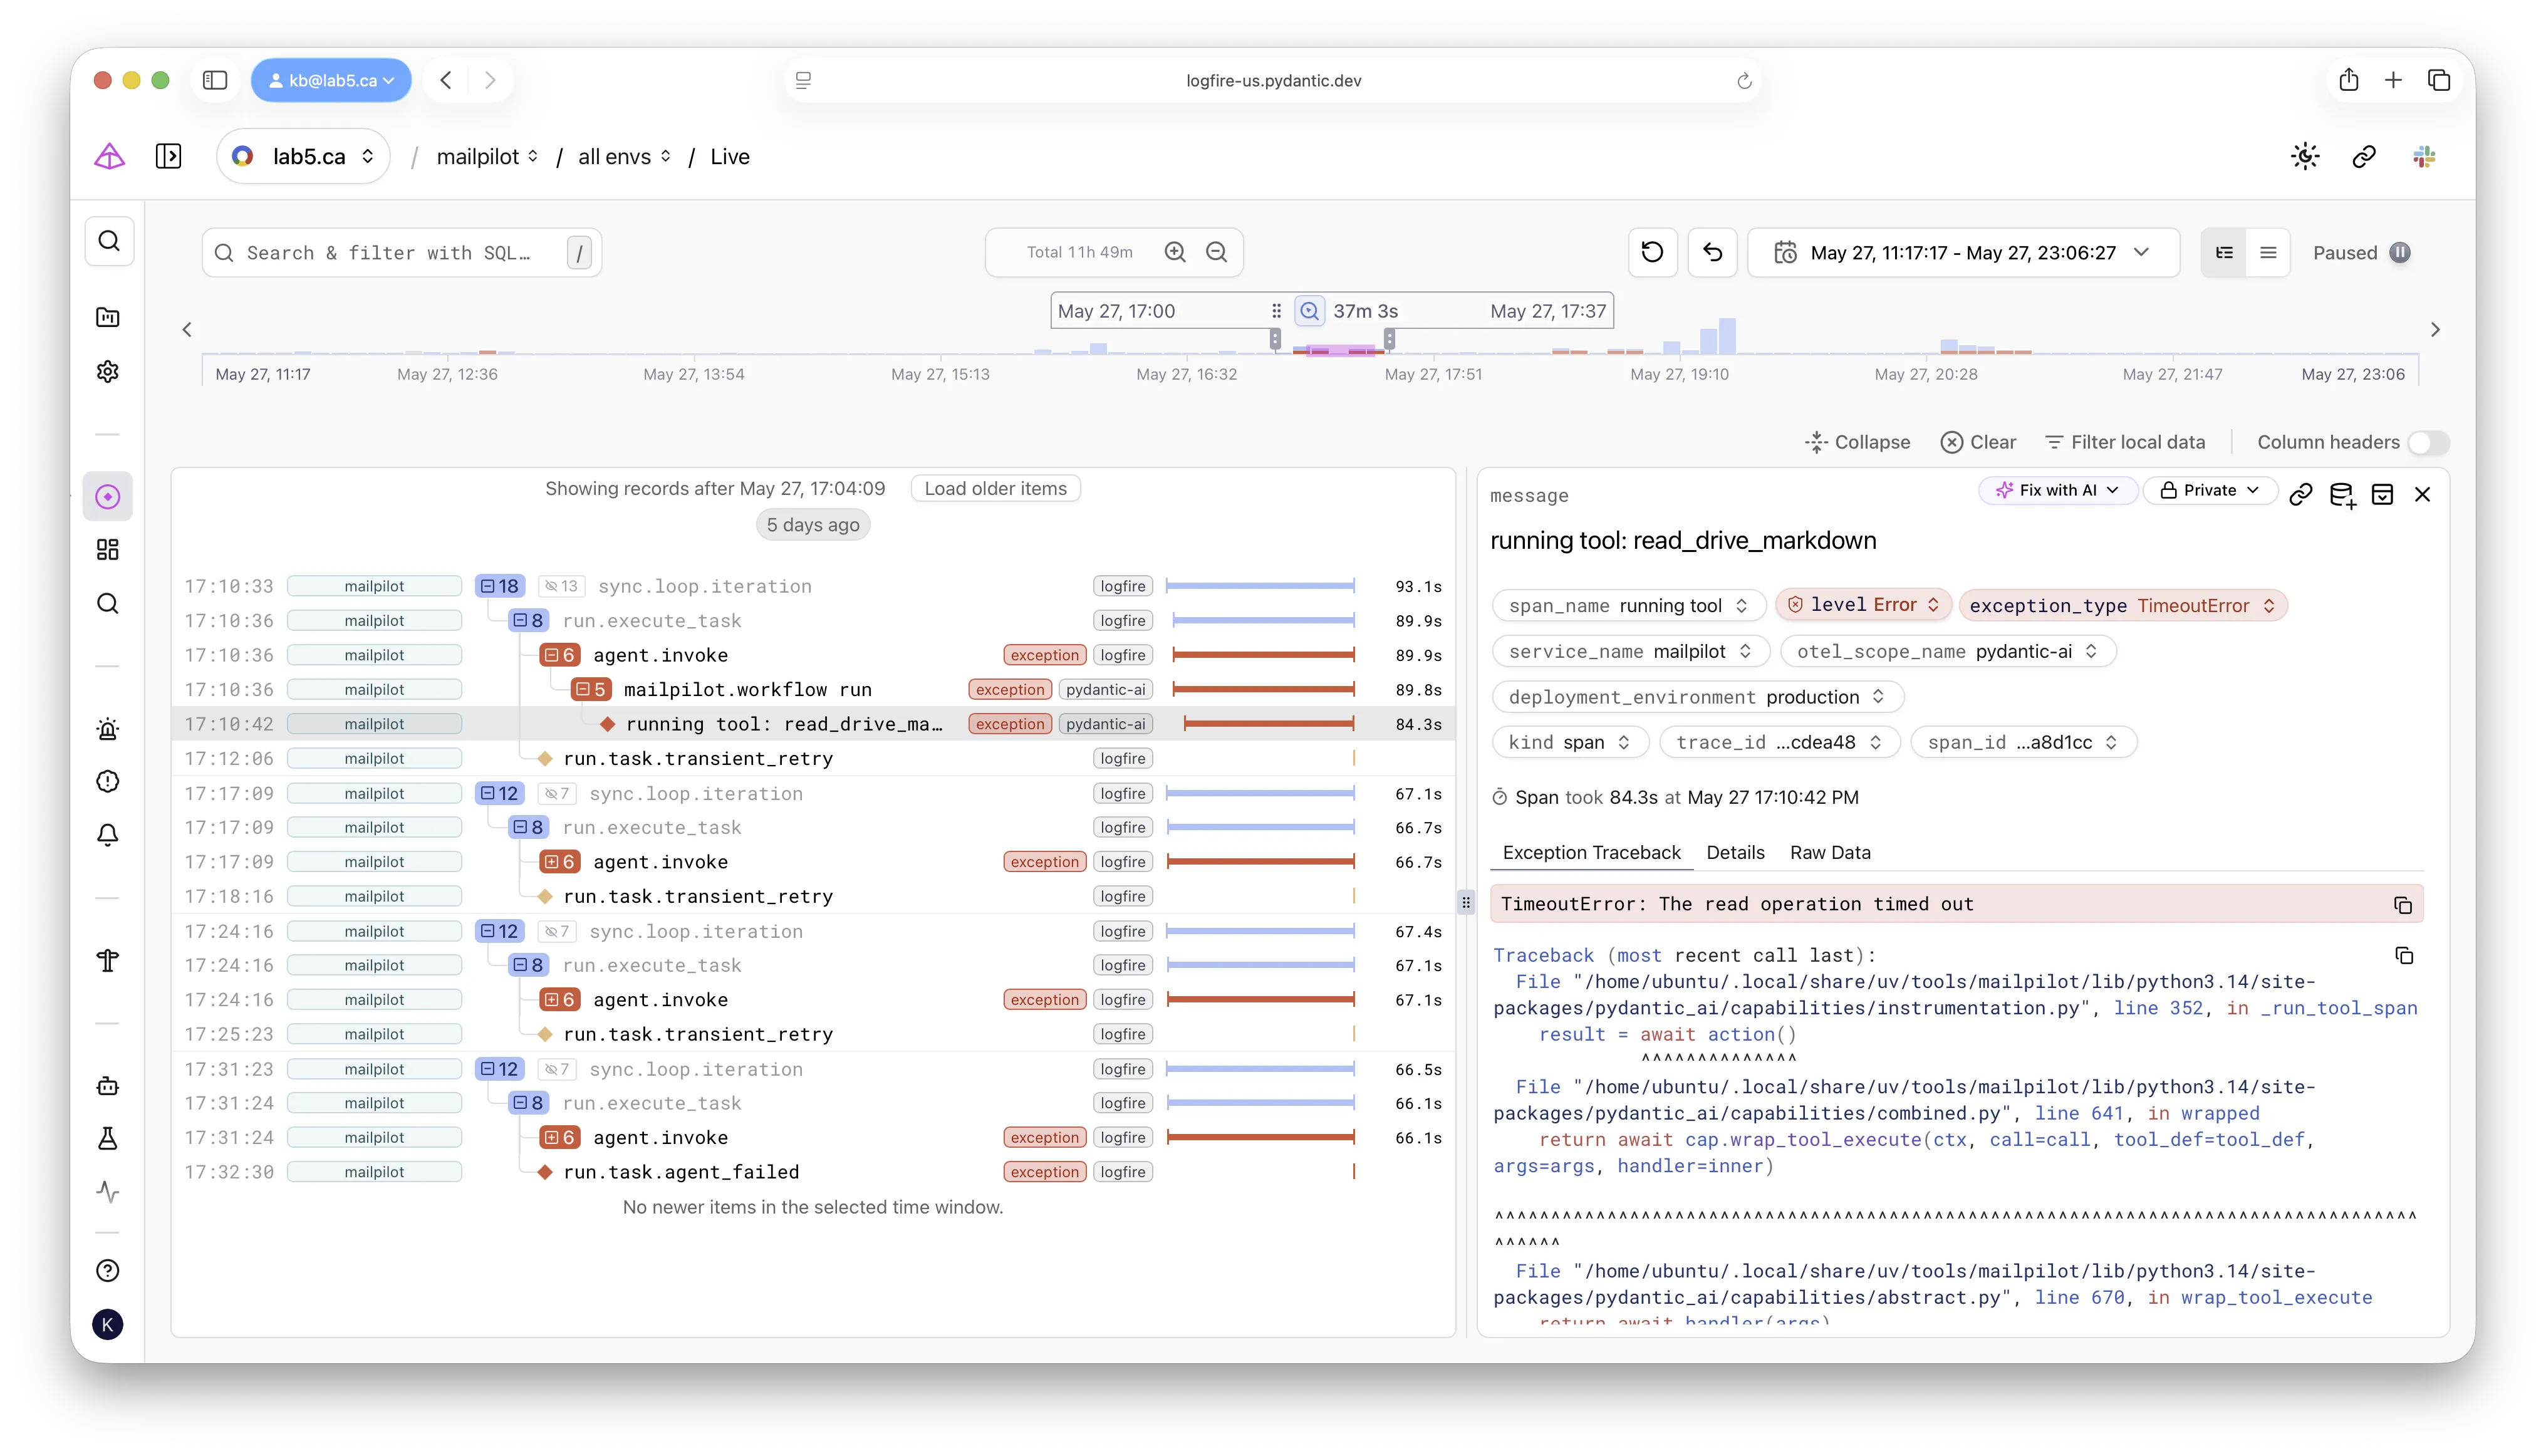 Following the exception down the tree:
the deepest span tagged with
Following the exception down the tree:
the deepest span tagged with TimeoutError is the read_drive_markdown leaf.
Everything above it — the agent run, agent.invoke, run.execute_task —
is just unwind path.
Two reading habits help here.
First, look at siblings under the same parent.
Concurrency bugs always show up as a duration mismatch between siblings of one operation.
Second, look at which span actually caught the exception.
In the tree above, TimeoutError propagates up from the deepest tool call
through agent run and agent.invoke to run.task.agent_failed.
The deepest span tagged with the exception is where the bug lives;
everything above it is just unwind path.
Query 3 — confirm it is deterministic
All four attempts ran ~66 seconds and landed in the same classifier branch — two minutes of SQL proves a deterministic bug, not a flake, before you waste an hour on it.
Before chasing the concurrency bug, you have to rule out coincidence. The retry counter says four attempts. Did they all fail the same way, or did one of them have a different shape?
SELECT start_timestamp, span_name, duration,
       exception_type, exception_message,
       attributes->>'attempt' AS attempt,
       trace_id, span_id, parent_span_id
FROM records
WHERE deployment_environment = 'production'
  AND attributes->>'task_id' = '019e6b46-66ea-75c2-846b-f02acf19b321'
ORDER BY start_timestamp ASC
LIMIT 200
For the example bug, every attempt was ~66 seconds long. Every retry landed in the same classifier branch. The first three waited the configured backoff — 30s, 120s, 300s — and the loop ran again with the same shape. The failure was deterministic and reproducible across attempts, not a flake.
This is the cheapest possible flake-vs-bug discriminator.
Two minutes of SQL, no code changes, no re-running anything.
Without it, the temptation is to just press retry and move on,
and the bug fires again next time the same input arrives.
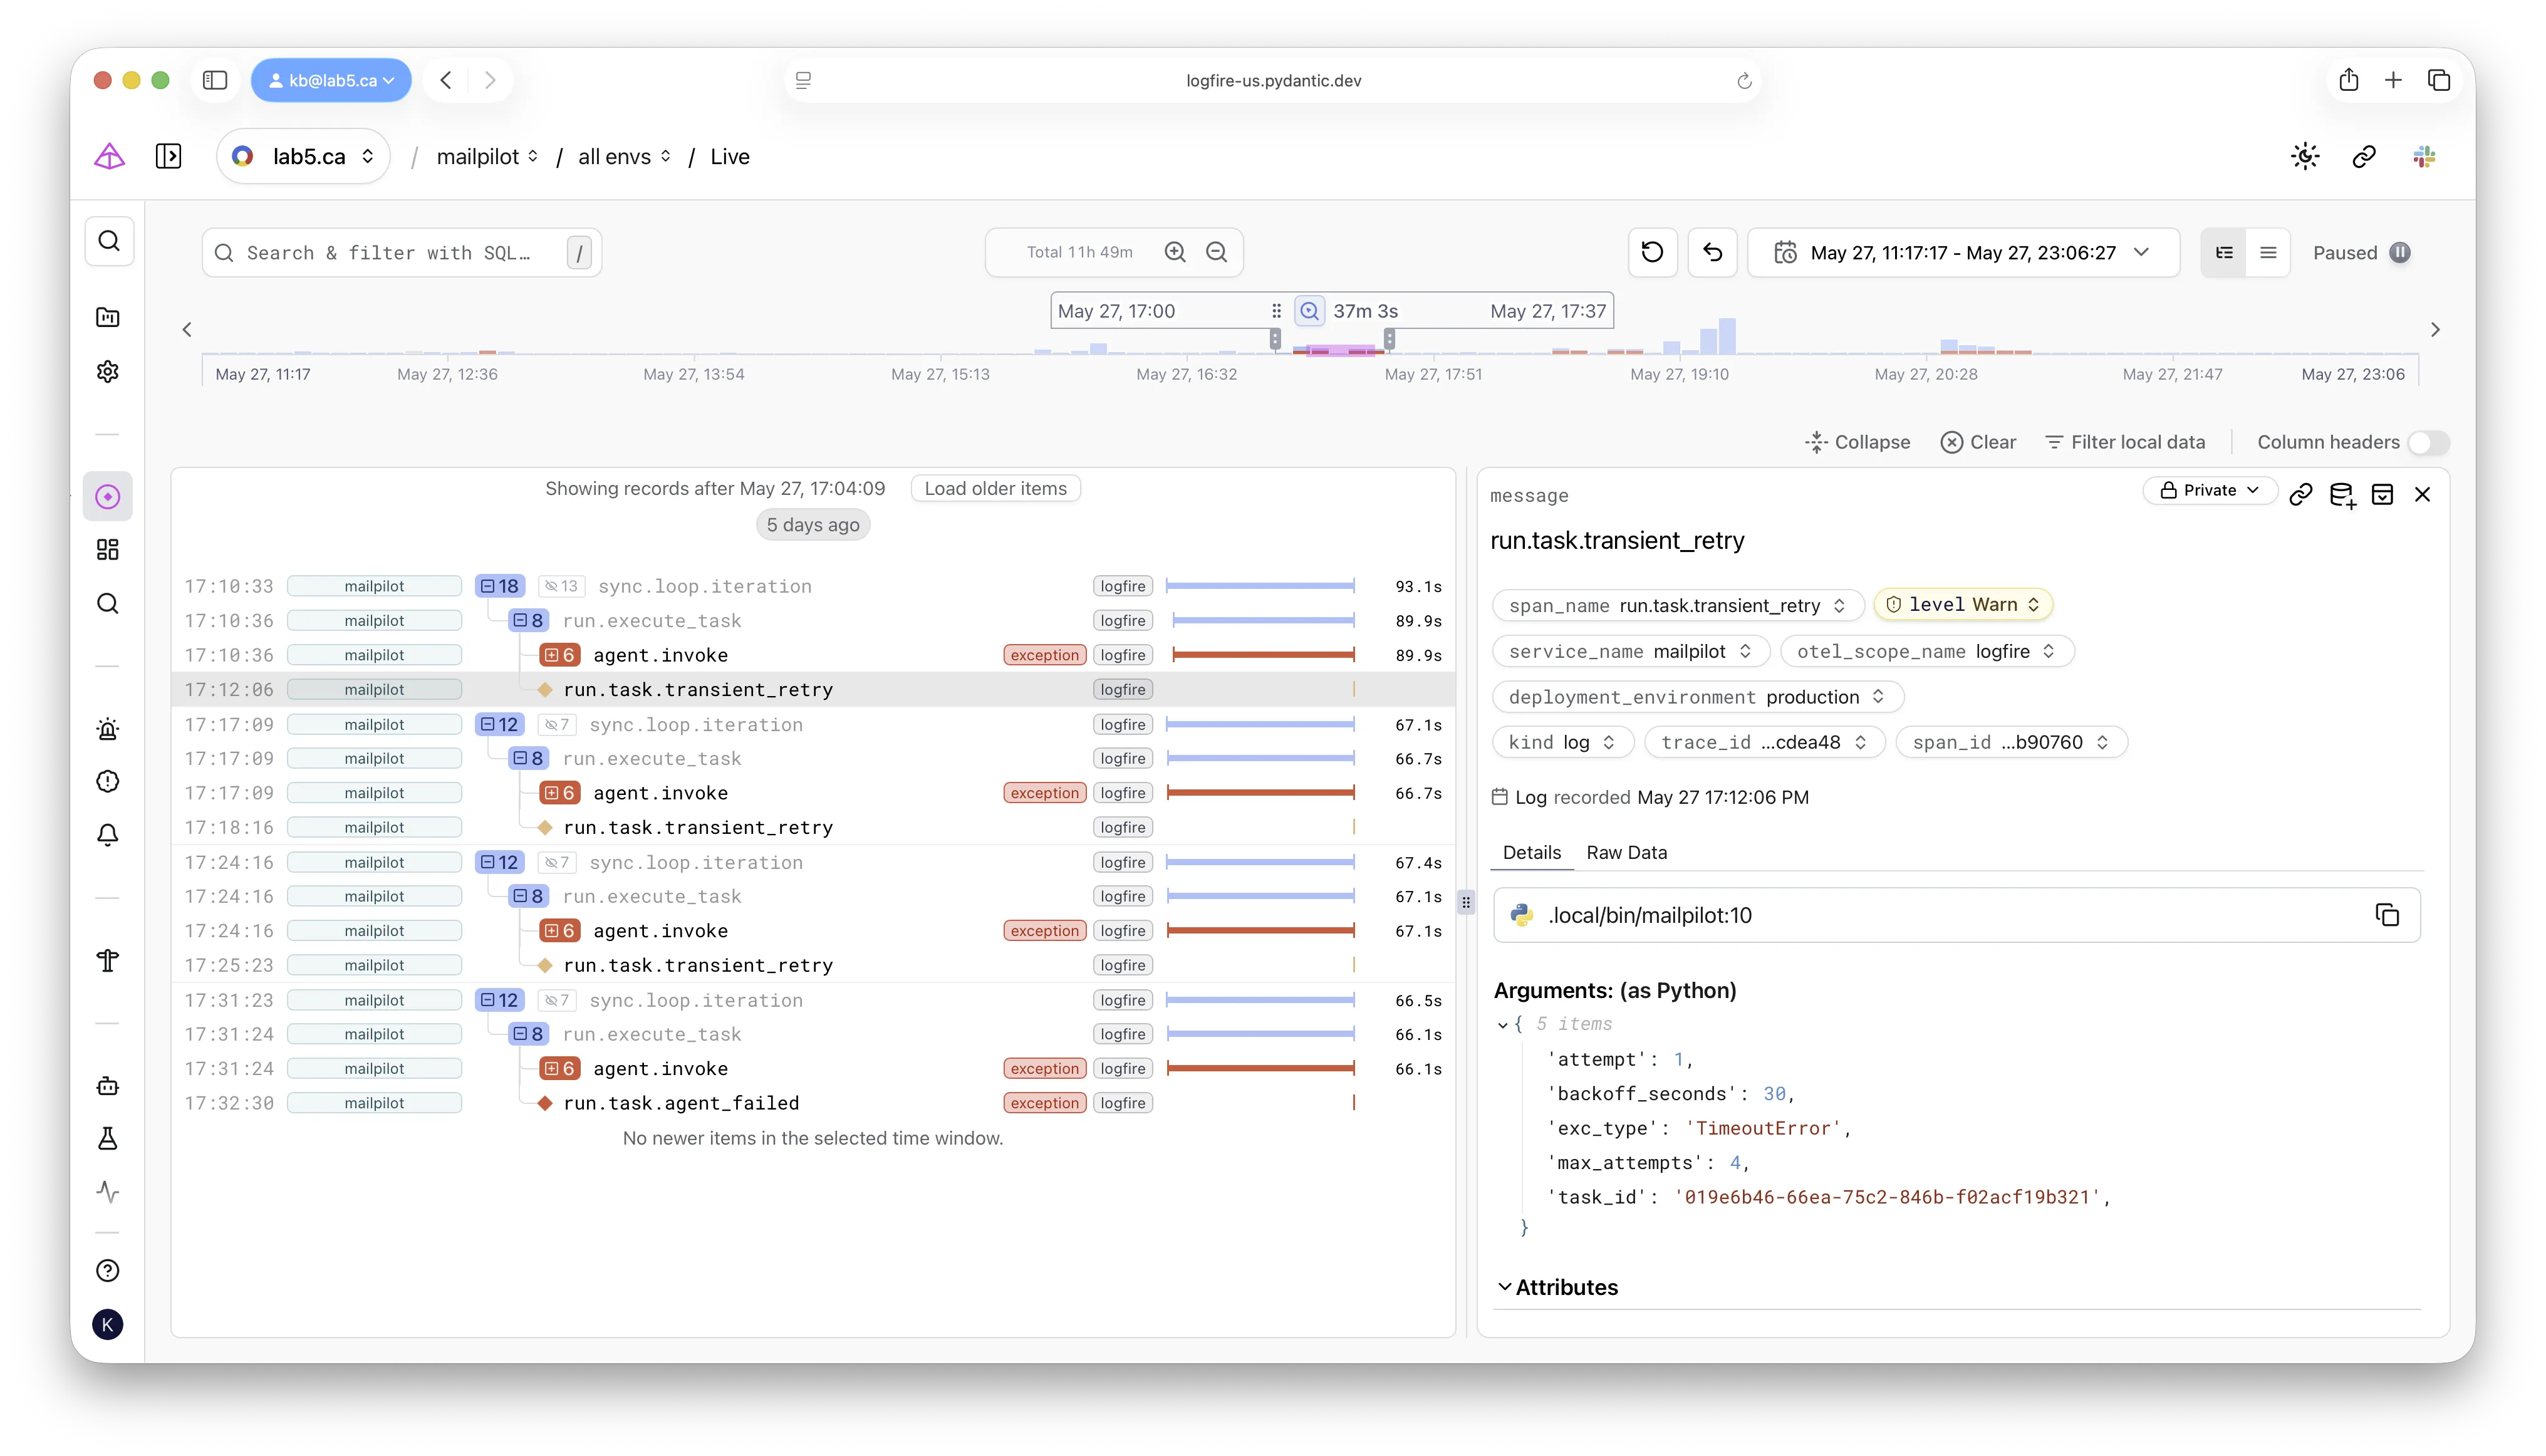 Four retries, one shape.
The
Four retries, one shape.
The attempt and backoff_seconds attributes on each retry row turn “it failed four times”
into “it failed the same way four times” — the difference between a flake and a bug.
Query 4 — extract the structured I/O
The structured arguments and responses are already on the spans — reading them showed the agent already had its answer from the fast call, so the bug was the harness, not the model’s reasoning.
Now you want the arguments and the responses.
The OTel gen_ai.* conventions put them on spans as structured attributes.
Plain SQL gets them out:
SELECT start_timestamp, duration, message, attributes
FROM records
WHERE deployment_environment = 'production'
  AND span_id IN ('9ac9256ed4b719be','ce04c860e83f80f5','34c5eb8884cb0cc4')
LIMIT 10
The three IDs are the LLM tool spans from Query 2.
Each span carried a tool_arguments field with structured input,
and the successful ones also carried tool_response with the full structured output.
From a single query I learned:
- The Drive search returned two near-duplicate files about the same product line.
- The model chose to read both files in parallel.
- The fast call — 1.12s — contained the full markdown including the answer the user was asking about.
- The hung call — 60.83s, timeout — contained a near-duplicate document.
So even if the hung tool call had failed gracefully, the agent already had the answer. The bug was never in the model’s reasoning. It was in the harness’s inability to survive a single tool exception when a sibling tool had already succeeded.
The OTel semantic conventions matter here.
Because the spans tagged tool name, call ID, arguments, and response as standardized fields,
the query needed no application-specific helpers.
The same shape works against any Pydantic AI deployment —
or any framework following the gen_ai.* conventions.
Bridging back to the source
The bridge from trace to source is one short move when the trace is this specific: open the failing span’s file, find the timeout constant, and read the surrounding code — here, a shared HTTP client that httplib2 documents as not thread-safe.
Logfire told me what was hanging. It did not, and cannot, tell me why. The bridge from trace to source is a separate move, but a short one when the trace has been this specific.
Two questions remain. Is the file itself broken? Is the application code mishandling concurrency? Both are quick to answer.
For the file: fetch it directly via a separate client, outside the application’s code path. In the example bug, downloading the “hung” file through a fresh Google Drive client returned valid markdown in under a second. The file was healthy; the application’s path to it was not.
For the code: open the file the failing span lives in and search for the exact timeout value. The hang was 60.83 seconds. Inside the source, on line 24:
_DRIVE_HTTP_TIMEOUT_SECONDS = 60And a few lines down:
def build_drive_service(email: str):
    import httplib2
    from google_auth_httplib2 import AuthorizedHttp
    from googleapiclient.discovery import build

    delegated = build_delegated_credentials(_DRIVE_SCOPE, email)
    authed_http = AuthorizedHttp(
        delegated,
        http=httplib2.Http(timeout=_DRIVE_HTTP_TIMEOUT_SECONDS),
    )
    return build("drive", "v3", http=authed_http)
One httplib2.Http(timeout=60) per client, wrapped in AuthorizedHttp,
shared across every Drive call within the agent run.
httplib2.Http is documented as not thread-safe —
it holds a connection-pool dict with no locking.
Pydantic AI dispatches synchronous function tools via asyncio.to_thread,
so two parallel tool calls land in two threads against the same client.
They contend on shared state.
One wins the underlying connection.
The other ends up stuck until the configured 60-second socket timeout fires.
Add the fact that the tool wrapper only catches HttpError and not socket.timeout,
and the bare TimeoutError escapes to kill the whole agent run.
The trace named the bug. The source confirmed it.
What each Logfire feature actually contributed
It is worth being explicit about which affordances did the work, because they are the things to look for in any tracing tool, not just Logfire:
- Span trees with parent-child structure. The single most important affordance. Two siblings of one LLM turn started 403 microseconds apart with vastly different durations and exception fates — that observation alone collapsed the search space from “anywhere in a multi-process system” to “concurrent tool dispatch.”
- Domain attributes on spans.
Filtering trillions of spans to the relevant handful in one
WHEREclause. No grep, no service-name gymnastics, no Python-side reconstruction. - OpenTelemetry semantic conventions. Standardized names for tool calls and arguments. The same SQL works across deployments.
- JSON attribute access via DataFusion.
attributes->>'task_id'reads like Postgres and behaves like Postgres. No bespoke query language; joins between records, issues, and metrics work the same way. - Cross-attempt aggregation.
A
task_idfilter showed the failure was deterministic across four attempts, not a flake. Without that, the diagnosis would have detoured into pressing retry. - First-class exception columns.
exception_typeandexception_messageare columns, not embedded substrings of a free-text log message.WHERE exception_type = 'TimeoutError'is the entry point for half of all investigations. deployment_environmentpopulated by default. Multi-environment tokens are the normal case at any real scale; a clean production view needs no per-service workaround.
The workflow, generalized
Strip the specifics off and the same five steps work for any application failure where you have a domain identifier and a trace store that respects OTel.
The trace, not the message, is the index.
- Filter by domain identifier.
Get a
trace_id. Stop guessing. - Pull the full trace tree. Look for sibling-duration mismatches, for the deepest span that carries the exception, and for spans whose duration matches a known timeout constant.
- Confirm determinism across retries. Two minutes of SQL prevents an hour of chasing a flake that is actually a bug.
- Extract structured I/O via semantic conventions. Arguments and responses are already on the span. Read them.
- Bridge to source. Open the file the failing span lives in, search for the duration constant, read the surrounding code with the trace tree as the index.
The order matters. Querying for I/O before pulling the tree wastes time on calls that turn out to be irrelevant. Bridging to source before confirming determinism risks fixing a flake. Pulling the tree before filtering by ID returns garbage.
If you operate any system where work fans out across threads, async tasks, or parallel tool calls, the shape of failure matters more than the message of failure. The retry classifier sees a message and calls it transient. The span tree sees a shape and tells you the truth.
Structured tracing is how you see the shape. The five queries above are how you read it.